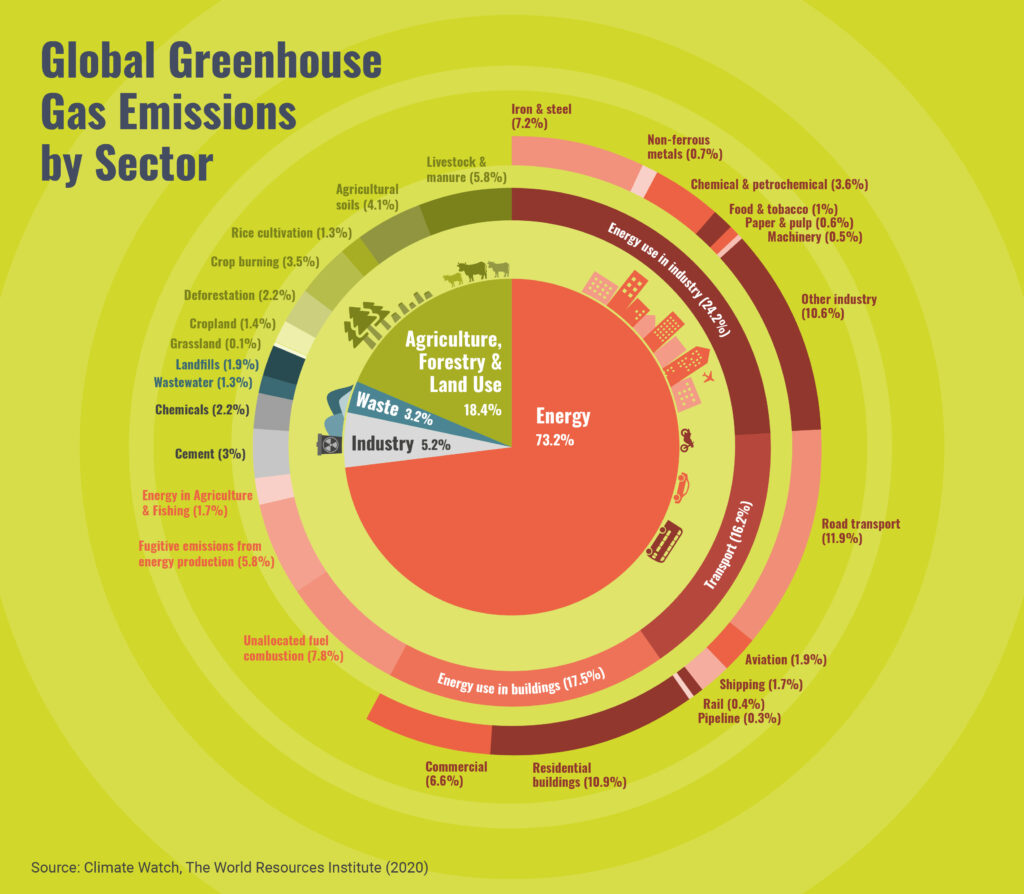
Global Greenhouse Gas Emissions by Sector as sourced from Climate Watch, The World Research Institute, 2020.
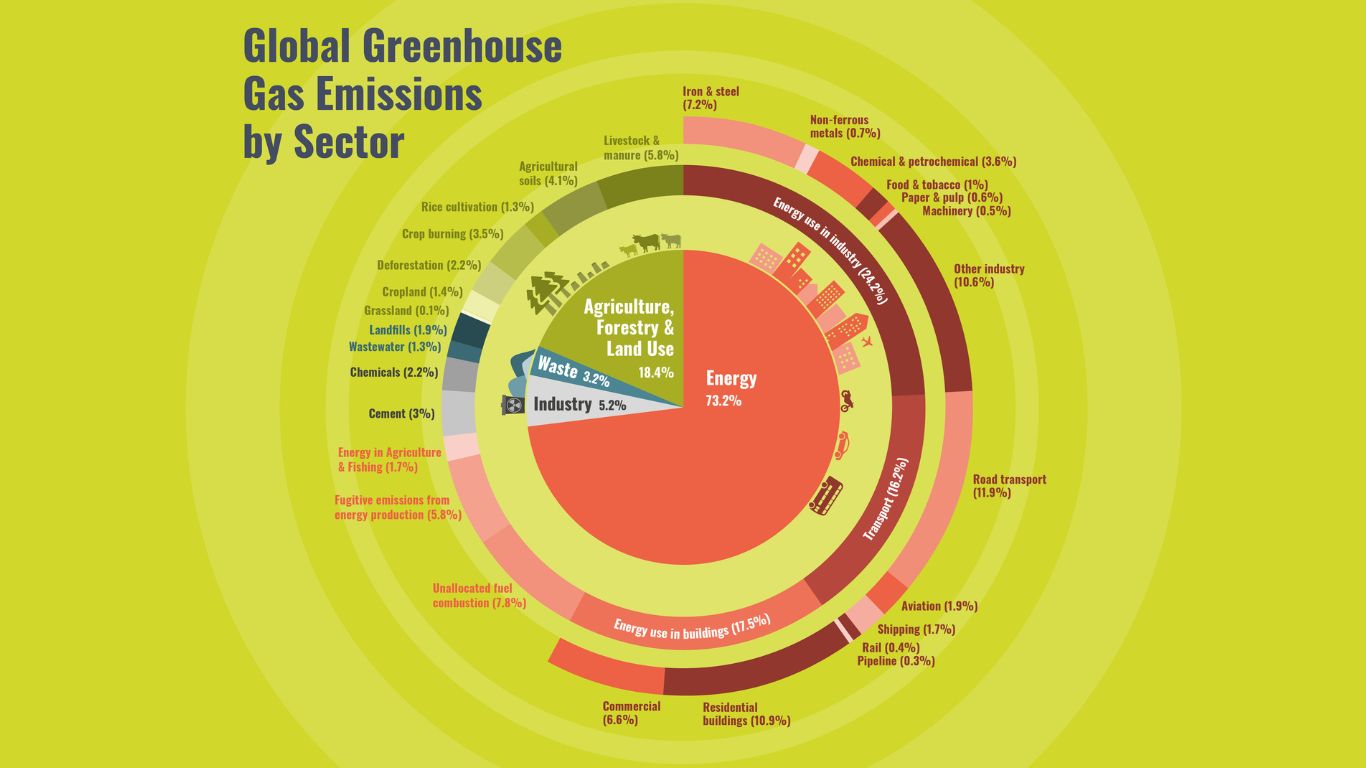
Global Greenhouse Gas Emissions by Sector as sourced from Climate Watch, The World Research Institute, 2020.
The Carbonwise editorial team is formed of seasoned established industry writers and specialist journalists.

26 January 2026
The European Union’s Carbon Border Adjustment Mechanism (CBAM) began its so-called ‘definitive regime’ phase on 1st January this year, meaning the tariff mechanism has moved from a reporting obligation to a real-world cost for companies...

15 January 2025
Under CCS, carbon emissions are captured and permanently stored, for example in geological storage sites.
23 December 2025
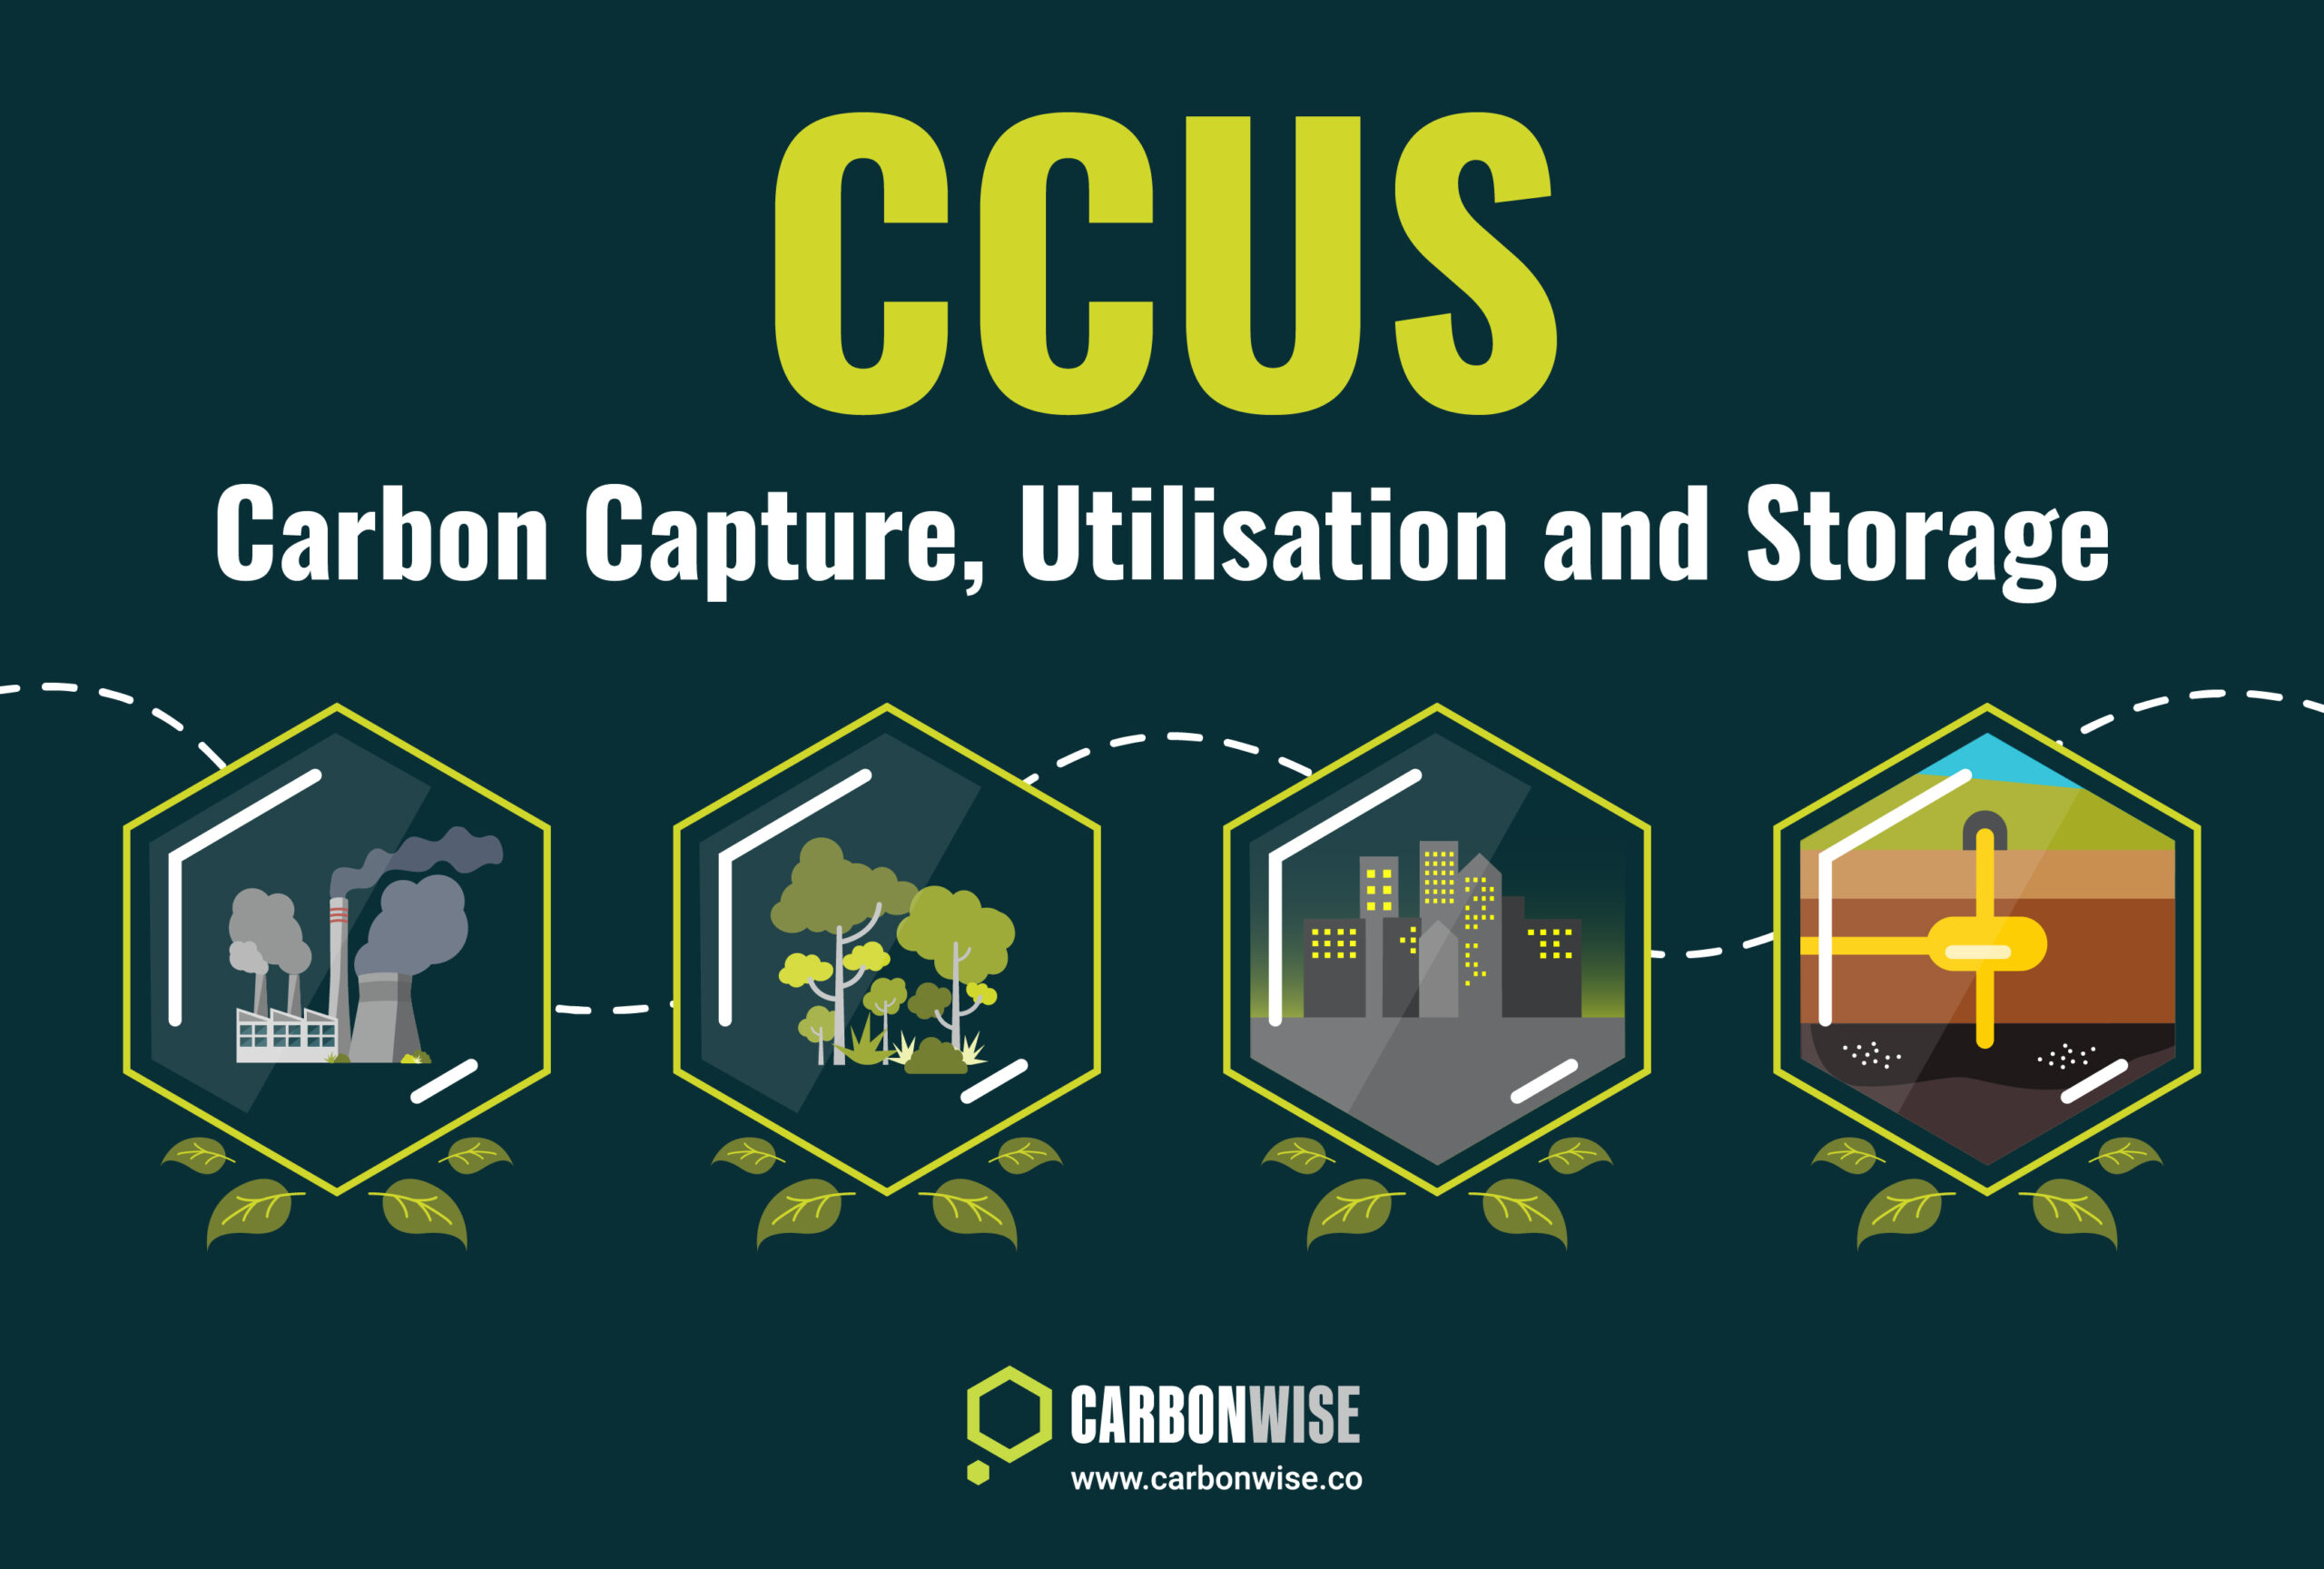
Carbon Capture, Utilisation and Storage (CCUS) is a method of reducing carbon dioxide emissions by trapping the gas for industrial use or permanent storage, preventing its release into the atmosphere.