Global Fossil Fuel Subsidies 2010-2022

Government subsidies on fossil fuels surged in 2022 in the wake of record high energy prices. Russia’s attack on Ukraine highlighted how dependent the world remains on oil and gas and how much further the energy transition still needs to go.
Global CO2 Emissions From Energy Combustion and Industrial Processes, 1900-2022

After a brief dip during the coronavirus-induced lockdowns, global emissions climbed to a record high in 2022.
Average Temperature Anomaly, Global

This ‘hockey stick’ shape chart illustrates how sharply average temperatures have risen in the last forty years with the world now almost 1 degree warmer than it was from 1961-1990.
Atmospheric CO2 at Mauna Loa Observatory
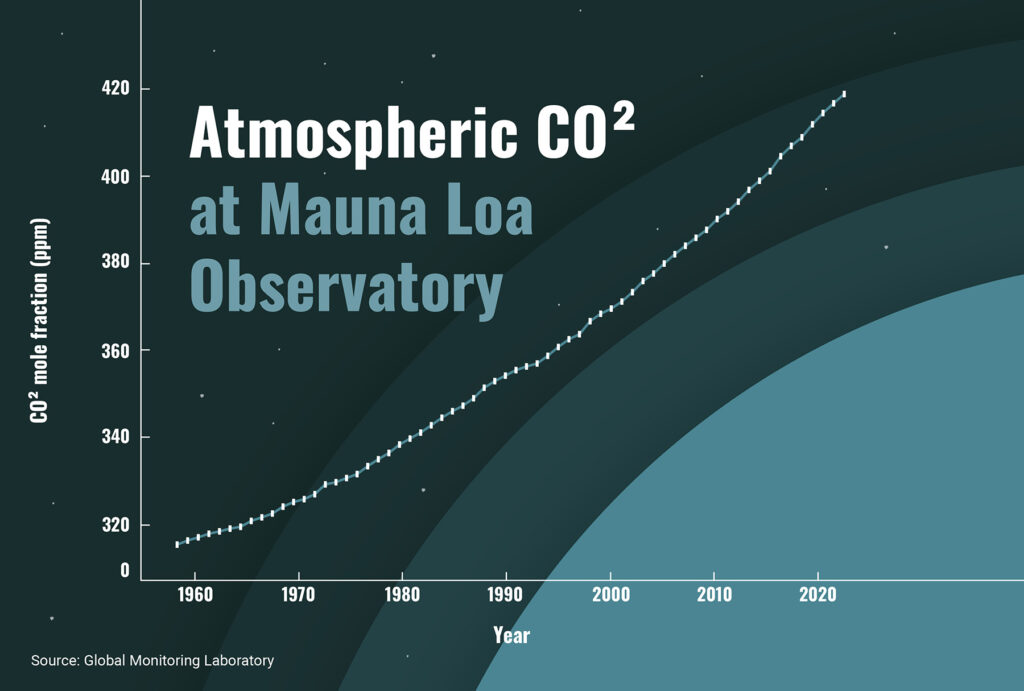
The amount of atmospheric CO2 has charted a steady climb higher. The Mauna Loa Observatory on the north flank of volcano of the same name in Hawaii is ideal for monitoring constituents in the atmosphere that can cause climate change.
Anthropogenic Carbon Emissions Over Time

This chart shows the total amount of man-made emissions created by the world’s biggest polluters.